Cincinnati sits at an elevation of 482 feet above sea level, with a population of just over 309,000 in the 2020 census. The city lies within the Ohio River valley, where glacial outwash deposits and alluvial soils dominate the subsurface. This geological setting makes understanding seismic wave propagation critical. A proper site response analysis evaluates how these local soil layers amplify or dampen ground motion. The approach follows ASCE 7-22 site class definitions, using measured shear wave velocities. When the project involves deep foundations, it is often paired with a masw-vs30 survey to capture velocity profiles across the site. The analysis directly informs structural design parameters for buildings and bridges.
Glacial outwash and alluvial soils along the Ohio River can amplify ground motion by 1.5 to 2.5 times versus bedrock.
Technical details of the service in Cincinnati
- Measurement of shear wave velocity (VS30) via MASW or downhole methods
- Laboratory cyclic testing on undisturbed samples
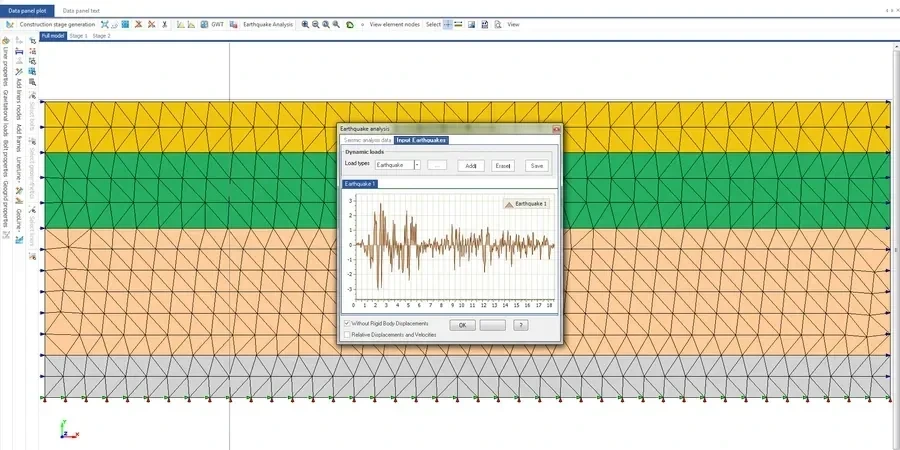
- Ground response modeling using equivalent-linear or nonlinear methods
Critical ground factors in Cincinnati
The Ohio River valley contains deep deposits of soft clay and loose sand extending up to 100 feet below grade. These materials exhibit nonlinear behavior under moderate to strong shaking. A site response analysis identifies the specific frequencies where amplification is likely. Without this study, structures may experience unexpected resonance during an earthquake. The 2011 Mineral, Virginia earthquake (magnitude 5.8) was felt strongly in Cincinnati, highlighting the region's vulnerability to distant seismic sources. Engineers must account for soil stiffness degradation curves, particularly in areas with high groundwater levels. The analysis also evaluates liquefaction susceptibility in sandy layers using NCEER-recommended procedures.
Our services
We offer three specialized services for site response analysis in Cincinnati. Each is tailored to project scale and site complexity.
VS30 Profiling via MASW
Multichannel Analysis of Surface Waves to measure vs30/" data-interlink="1">shear wave velocities at depths up to 100 feet. Results classify the site per ASCE 7 and provide input for ground response models.
Site-Specific Response Spectra
Nonlinear and equivalent-linear analyses using SHAKE or DEEPSOIL. We generate acceleration time histories and response spectra for structural design.
Liquefaction Hazard Evaluation
SPT-based and CPT-based liquefaction triggering analysis per NCEER guidelines. Includes post-liquefaction settlement and lateral spread estimates.
Quick answers
What is the difference between site response analysis and standard seismic design?
Standard seismic design uses generic spectra from building codes. A site response analysis replaces that with spectra calculated specifically for your Cincinnati site. It accounts for local soil layering, stiffness, and damping. The result is a more accurate prediction of ground shaking at the surface.
How much does a site response analysis cost in Cincinnati?
Costs typically range between US$1,420 and US$3,940 depending on site size, number of boreholes, and required laboratory testing. A full scope includes VS30 measurement, cyclic testing, and response modeling. Contact us for a project-specific quote.
Which Cincinnati areas require the most careful site response evaluation?
Areas along the Ohio River floodplain, including parts of Over-the-Rhine and the West End, have deep soft soils. The Mill Creek Valley also contains thick deposits of compressible clay. Sites with more than 50 feet of alluvium should always undergo site response analysis.
What standards govern site response analysis in Ohio?
The primary standards are ASCE 7-22 for seismic loads and IBC 2021 for building design. We also follow ASTM D4428 for seismic testing and NEHRP guidelines for nonlinear analysis. The Ohio Building Code adopts these by reference.